When what Gets Measured Gets Ignored. Why Metrics Often Backfire
November 4, 2025
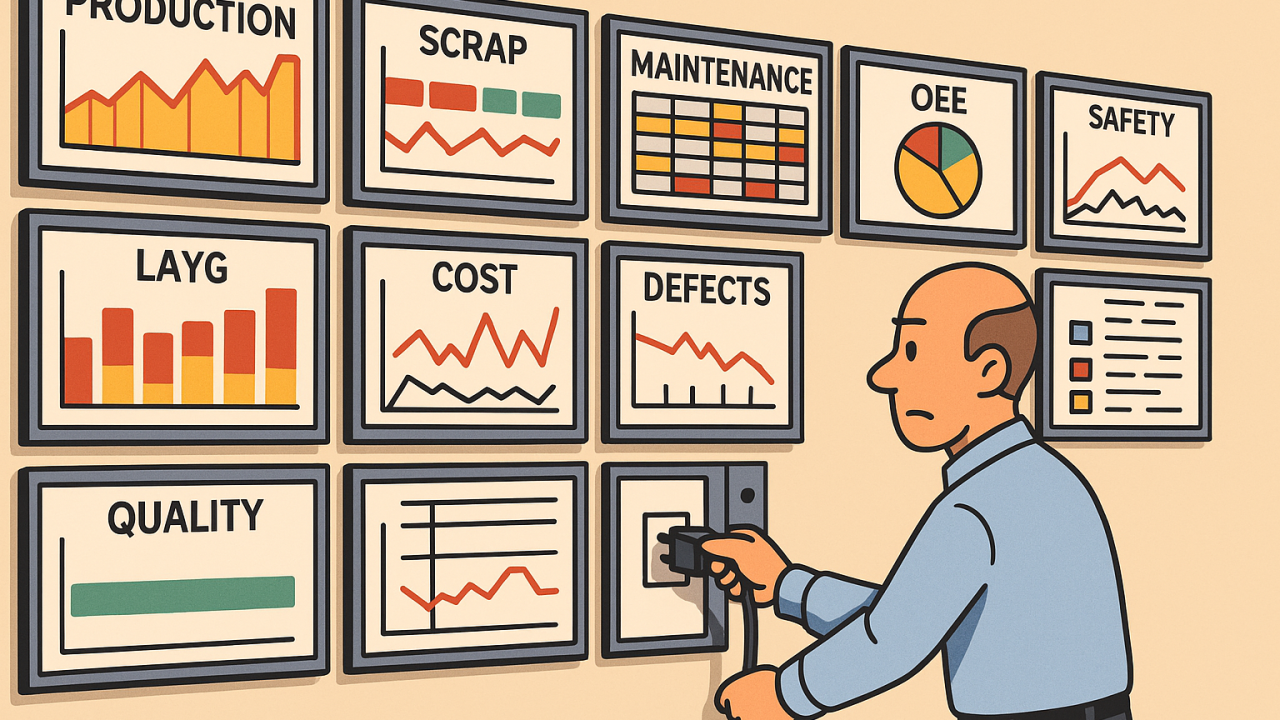
Not that long ago, I visited a plant that proudly displayed more dashboards than I had ever seen. Net Promoter Scores, Production charts, scrap trends, maintenance logs, OEE by shift, delivery rates, safety, quality, cost, and many others. All beautifully and properly color-coded.
But when I asked a simple question
"Which one of these matters most today?" No one could answer.
That's when I realized: they were measuring everything and improving nothing.
The Illusion of Control
Leaders love data. It feels objective, scientific, and safe. But when every process has dozens of KPIs, people start chasing numbers instead of results. They stop thinking and start reacting. Do you see how this practice consumes valuable resources that could instead be adding value to the customer?
In the Manufacturing Simplicity world, metrics are supposed to illuminate, not overwhelm. When they multiply without purpose, they create confusion, not clarity.
A flood of indicators gives the illusion of control while hiding what truly matters: the flow of value to the customer.
Too Many KPIs = No Priorities
Here's the trap: When everything is important, nothing is important.
I've seen teams celebrate green dashboards while customer complaints rise, or hit output targets while scrap quietly increases. It happens because metrics compete instead of aligning.
In a well-developed system, every KPI connects upward, from daily actions to strategy. When that chain breaks, metrics turn into silos.
If you want focus, pick fewer metrics and make them mean something.
Leading vs. Lagging
Another common mistake: measuring only what has already happened. Delivery rates, cost per unit, and OEE. These are lagging indicators. They tell you yesterday's story. Of course, they are useful, and we can write a future article about what to do with them.
But if you want to change outcomes, measure leading indicators, those things that predict performance:
- % of standard work followed
- number of improvement ideas implemented
- average time to detect and solve problems
Those show whether your system is healthy, not just whether it hit the scoreboard.
Visual Management Beats Data Dumps
A great visual board doesn't need numbers to tell the truth. You can walk by and immediately see whether things are flowing or stuck. That's Lean leadership: go and see, not scroll and guess.
When everyone can see performance, discussions change from "Who messed up?" to "What needs to improve?"
Transparency creates ownership, and ownership drives improvement.
Closing Thought
Metrics should focus effort, not dilute it. If your team is buried in numbers, step back and ask:
"Do our metrics help us see the truth or hide it?"
Measure less, understand more, and let clarity lead improvement.
Because sometimes, what gets measured gets ignored.
#ManufacturingSimplicity #LeanLeadership #KPIs #ContinuousImprovement #VisualManagement #OperationalExcellence #LeanThinking